


Image Source, modified under CC license.
Since 2017, I’ve spent time studying financial statements of companies in two markets I believe are attractive: Energy and Emerging Markets (with an emphasis on China).
Many energy and Chinese stocks, based on their financial statements, are attractive for the purpose of ‘rent collection’. By ‘rent collection’, I mean enjoying an ongoing stream of earnings from the business, flowing through the company, and into one’s pocket in the form of dividends.
Using some traditional metrics – like discount to book value, price-to-earnings ratios, leverage (debt & liabilities), management/employee ownership, one can narrow down a basket that meet the type of criteria that famed value-investor Ben Graham and his students would often target – price to book ratios of less than .60x, price-to-earnings ratio under 7x, and enjoyable dividend yields of 5%-6%+.
Alternatively, there are historical extremes of the opposite type, in terms of pricing of U.S. stock market indexes and individual companies. There are an abundance of U.S. companies selling at prices higher than 12x book value and 20x-30x+ times price-to-earnings ratios. In addition, there are many multi-billion dollar market cap (USD) companies which have never reported a single cent in positive Net Annual Income on their income statements.
There is clearly an extreme difference in asset pricing, when comparing U.S. equity markets, versus global energy and Chinese securities.
Given the difficulty of gauging how much money exists at any given time and determining whether any asset is actually cheap in US dollar terms— I’ve come to enjoy using ratios, such as the gold to silver ratio, gold to oil, or gold to the Dow Jones Industrial Average.
In this case, I thought to use ratios to help determine if the sectors I am looking at are ‘historically cheap’, relative to other things.
Here is a ratio chart of West Texas Intermediate Crude (WTIC – a benchmark global energy product), versus the Dow Jones Industrial Average (DJIA):

Source: StockCharts.com
Going back 25 years, the WTIC to DJIA ratio is currently in a pricing band which was only visited 4 times: 1998-1999, 2001-2002, 2016, and late 2018.
In each of those periods, the extreme low ratio (suggesting WTIC to be cheap) violently reversed higher, and not long after. In addition, the nominal WTIC price also reversed.
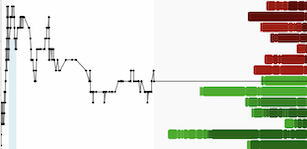
Here is a chart of WTIC, with those same ratio-bottoming years circled in red:

Source: StockCharts.com
As you can see, not only did the ratio snap higher in favor of WTIC during all 4 circumstances, but so did the USD pricing of WTIC.
Recovering off the 1999 ratio bottom – WTIC registered at total move of 200% +/-. In the recovery off the 2001-2002 bottom, WTIC moved up over 100%. In 2016, WTIC shot up over 100%, and in late 2018, moved up over 50%.
There is no guarantee WTIC will move higher from its current price, or from its current WTIC/DJIA ratio. Additionally, there is no guarantee that energy securities—a broad global industry—will move higher in sympathy with a hypothetical recovery of WTIC.
However, when one sees the combination of extreme asset class/index ratios, combined with baskets of attractively-priced individual securities within that asset class – those could be ‘warning flags’ (in this writer’s opinion) of a ripe condition for price recovery.
In looking at the Shanghai Stock Exchange Composite (SSEC) Index relative to the DJIA—it too, is registering price ratio extremes that are within a 25-year bottoming range:

Source: StockCharts.com
Following each of the four prior ratio bottoms – 1996, 1999, 2005, and 2014, the SSEC demonstrated a violent reversal to the upside, in favor of Chinese stocks relative to the DJIA.
In addition to a reversal in the SSEC/DJIA ratio, the pricing of the Shanghai exchange index reversed higher following each of those 4 ratio bottoms as well, as shown below:

Source: StockCharts.com
Recovering off the 1995 ratio bottom – SSEC registered at total move of more than 170%. In the recovery off the 1999 bottom, SSEC moved up roughly 100%. In 2005, SSEC began a move which totaled over 500%, and in late 2014, began a move roughly totaling 160%.
There is no guarantee the SSEC index will move higher from its current price, or from its current SSEC/DJIA ratio. Additionally, there is no guarantee that all Chinese securities will move higher in sympathy, with a hypothetical move higher of the SSEC index.
However, when one sees the combination of extreme asset class/index ratios, combined with baskets of attractively-priced individual securities within that asset class – those could be ‘warning flags’ (in this writer’s opinion) of a ripe condition for price recovery.
It should be noted that the Hong Kong exchange contains a healthy number of dual listings from the Shanghai Exchange, as well as companies with Chinese Mainland focused businesses, whose sole Asian listing is on the Hong Kong exchange.
However, the Hong Kong stock market also contains a large number of companies exposed to Hong Kong real estate, and other industries whose pricing behavior has moved in sympathy with Western (U.S.) financial markets. It has mainly been ‘mainland’ focused businesses, whose share prices have lagged.
I’ve spent the last few years looking over financial statements in search of stock market bargains. The trail of good numbers (and cheap companies) has led me east, toward Emerging Markets (China in particular), and to Energy companies.
Today, one can use traditional stock valuation metrics to build a portfolio of cheap energy & Chinese (mainland-focused) stocks, in which large companies with years (or decades) of stable earnings can be bought for an attractive price and dividend yield (akin to ‘rent collection’).
If history repeats itself, the multi-year ratio extremes between the WTIC/DJIA, and SSEC/DJIA, may reverse violently to the upside, in favor of global energy and Chinese (mainland) securities.
If individual company selection is outside of one’s skillset, ETF’s can be time & cost efficient.
Thoughts?
Please let me know: tdasilva@sprottglobal.com
Thanks,
Tekoa Da Silva
Important Disclosures:
This paper is for information purposes only and is not intended to be an offer or solicitation for the sale of any financial product or service or a recommendation or determination by Sprott Global Resource Investments Ltd. that any investment strategy is suitable for a specific investor. Investors should seek financial advice regarding the suitability of any investment strategy or product based on the objectives of the investor, financial situation, investment horizon, and their particular needs. This information is not intended to provide financial, tax, legal, accounting or other professional advice since such advice always requires consideration of individual circumstances. The products discussed herein are not insured by the FDIC or any other governmental agency, are subject to risks, including a possible loss of the principal amount invested.
Investing in securities involves risk of loss that clients should be prepared to bear. No investment process is free of risk; no strategy or risk management technique can guarantee returns or eliminate risk in any market environment. There is no guarantee that our investment processes will be profitable. Past performance is not a guide to future performance. The value of investments, as well any investment income, is not guaranteed and can fluctuate based on market conditions. Diversification does not assure a profit or protect against loss.
