


The US debt ceiling issues likely present a much greater risk to financial markets than currently perceived by investors. Although prior concerns related to this matter have proven to be mostly peripheral, today’s set of circumstances is different. The possibility of a technical default looms once again, however, our main concern is the potential macroeconomic consequences following a resolution between the political parties. Allow us to explain.
During periods that require a debt ceiling extension, the Treasury cash balance for daily operations tends to be at extremely low levels, which is the case again today. Once an agreement is reached, the government must issue debt promptly in order to sustain its functions due to the persistent fiscal deficit imbalance. Over time, the issuance of Treasuries has been increasing steadily, and this time around, we anticipate an unprecedented surge in the amount of debt being raised in the ensuing months. All else equal, this should exert major downward pressure on the price of these fixed-income instruments.
In the past, the lack of inflation concerns, the willingness of foreign trade partners to buy rather than sell Treasuries, the absence of domestic bank failures resulting from their holdings of these instruments, and the Fed’s highly accommodative stance allowed the market to smoothly absorb the growing Treasury supply without significant disruptions. Today, given the adverse macro environment, the emergence of a supply-side problem requires much greater attention.
It cannot be overstated that the US Treasury market serves as the cornerstone of the entire financial system. The inflated valuation of financial assets hinges on a low cost of capital environment, making it a crucial factor in the overall economy.

Foreign Buyers Are Far Gone
It is worth noting that the recent positive developments related to a potential resolution of the debt ceiling have coincided with upward pressure on long-term interest rates. Market participants are beginning to recognize that the true risk this time around lies not in the failure to reach an agreement, but rather in the escalating and concerning nature of the debt problem. This concern is further amplified by the diminishing availability of buyers for Treasury securities.
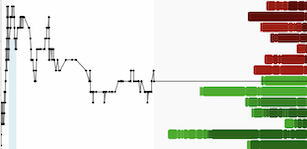
In the last three years, the responsibility of absorbing this debt fell on the Fed and US banks, but now both entities have withdrawn from that role. Additionally, as shown in the chart below, foreign investors have not been net purchasers of US Treasuries despite the substantial influx of issuances in the last decade. The current lack of demand is indeed a growing problem that may ultimately necessitate the intervention of the Fed as the buyer of last resort.
We can recall the historic selloff of UK Gilts last year, triggered by a tax cut announcement that investors perceived as posing a significant risk to the country’s financial stability. This situation led the Bank of England to reverse its quantitative tightening (QT) course and intervene as a buyer of UK bonds.
In our strong opinion, the US is primed to have its own BOE moment.

Central Banks Reversed Their Stance Once Again
Given the dire levels of global debt, foreign central banks are compelled to prioritize enhancing the quality of their international reserves to support their monetary systems. In essence, these institutions function similarly to traditional businesses that require high-quality assets on their balance sheets to establish financial stability.
Following the end of the gold standard in 1971, central banks continued to purchase gold for the next decade. At its peak, gold holdings constituted 72% of their overall balance sheet assets. Subsequently, due to a prolonged period of increase in interest rates, central banks opted to accumulate US debt at historically attractive valuations. This occurred during a time when the world economy was also progressively becoming more globalized, which significantly fueled the substantial demand for Treasury instruments. Consequently, these instruments experienced nearly 30 years of continuous appreciation. Other notable institutions such as pension and endowment funds soon followed suit, resulting in the highly favorable 60/40 portfolio position from the early 1980s until recently. This created a structural effect where the high demand for Treasuries resulted in decreased interest rates, consequently contributing to inflated equity market valuations.
Now, foreign central banks have reversed their stance again. They are significant buyers of gold while some have become major sellers of US debt. Escalating geopolitical conflict has increased the importance of owning a neutral asset with no counterparty risk that also carries centuries of credible history as a haven. Gold is the only asset that qualifies. Central banks have thus pivoted to being substantial buyers over the last several years leading to a rising percentage of gold ownership on their balance sheets. As a percentage of foreign reserves, if this measurement were to return to its historical average of 40%, all else equal, it would be an injection of approximately $3.2 trillion of new capital into the gold market. Price would have to be the reconciling factor in accommodating this demand. Since $3.2 trillion is 25% of the total value of all above-ground gold, or essentially all the gold ever mined, which now stands at $13 trillion, a 25% upward adjustment in price would get the gold price to $2,500 an ounce, Crescat’s minimum one-year target. More importantly, this dynamic is expected to prompt other major institutions and individual investors to follow suit, triggering an even greater influx of capital into the gold and precious metals markets. We expect much of this new demand will flow into the mining industry where the deep value is substantially more compelling in this macro environment with multi-fold appreciation potential in companies with big, viable new and incipient discoveries.

A Rude Awakening for 60/40 Portfolios
Market correlations undergo changes when the macroeconomic regime itself undergoes a shift. Traditional 60/40 portfolios experienced a rude awakening in 2022, which likely marked a turning point in the interrelationship of asset classes. While both the equity and bond markets faced challenges simultaneously, gold showed exceptional resilience. This recent market behavior is reminiscent of the other inflationary periods, particularly the 1970s, although the circumstances then were significantly different from today. Given the substantial levels of debt and imbalances in asset valuations, we feel it is unlikely for interest rates to rise in the same manner as they did in the 1970s over the next decade without causing a financial calamity.
Therefore, in a world where policymakers must inevitably intervene to suppress the cost of debt, irrespective of varying perspectives on the potential effectiveness of such actions, gold would likely emerge as a key monetary asset to own carrying centuries of credibility as hard money. This is particularly relevant today as the valuation of US Treasuries remains historically expensive.
It is worth noting that during the 1970s, US 10-year interest rates averaged around 7.5%, making long-term Treasuries significantly more appealing in terms of valuation, with a price-to-earnings (P/E) ratio of 13x. In contrast, in the present day, with a P/E ratio of 28x, if the rationale for owning these instruments is solely based on the premise that the system cannot endure substantially higher interest rates, then gold would be a far superior choice.

A Growing Debt Problem, But This Time Gold Prices Are Unpegged
While the 1940s serve as an important historical parallel due to the seriousness of the current debt issue, there is a significant distinction: during that period, gold was effectively tied to the US dollar, rendering it an impractical investment alternative. Today, with prices unpegged, it is highly probable that capital will divert from US Treasuries and flow into gold.

Triple Tops Almost Never Work
We note that gold is the only macro asset trading near record prices today. While there are inexorable fundamental drivers to push it much higher, from a technical perspective, the metal has recently encountered historical resistance after re-testing previous highs. More importantly, triple-top formations often prove to be temporary with prices eventually breaking out to the upside in a significant way.
Once the metal decisively achieves record prices, it is likely to spark a new gold cycle. These cycles, characterized by long-term trends, have occurred only twice in the past 50 years: during the 1970s and the 2000s. The current market conditions present an exceptionally strong array of fundamental and macro drivers for precious metals, arguably the most robust in history, which include:
- Central banks compelled to purchase gold to enhance the quality of their foreign exchange reserves;
- The likelihood of global gold production entering another secular decline, akin to the bull markets of the 1970s and 2000s which supports the supply side;
- Failing 60/40 portfolios seeking alternative safe-haven assets;
- Inflation expectations exceeding the historical average for this decade, driving the need for tangible assets;
- Commodities being historically undervalued compared to financial assets;
- A significant number of yield-spread inversions in the US Treasury curve, surpassing the 70% threshold, making a compelling case for owning gold and reducing exposure to overvalued stocks;
- Major mining companies inclined to ultra-conservatism, prioritizing returning capital to shareholders over investing in the current and future production of precious metals;
- Insufficient investments in exploration resulting in a lack of new gold and silver discoveries, compounded by the geological challenges of finding new mineral deposits;
- ESG mandates and government pressure deterring the development of new resource projects;
- Institutional investors pressuring traditional gold-focused companies to pivot to green metals;
- Doubt surrounding precious metals due to the surge of speculative interest in digital assets, totally unwarranted due to the credibility and historical significance of gold as the one enduring and truly scarce monetary asset in contrast to a plethora of easy-to-produce digital assets; and
- The US and other developed economies are currently facing a trifecta of macro imbalances:
- The debt problem reminiscent of the 1940s
- A speculative environment like the late 1920s and 1990s
- Inflationary concerns akin to the 1970s

Structural Inflationary Forces Abound
Having benefited greatly from globalization, cheap labor, and abundant natural resources, it appears that we have entered a new economic regime. The pandemic crisis exposed several long-standing macroeconomic forces that are now beginning to permeate the economy. While the growth of consumer prices for goods and services has slowed, it is important to remember that inflationary periods tend to develop in waves.
Given the structural nature of many of today’s drivers, we believe it is only a matter of time before the next wave of inflation ignites.
The percentage of labor costs relative to corporate profits is starting to rise from historically low levels. Although a near-term recession could potentially slow down the pace of wage growth, structurally speaking, considering the persistently high cost of living, it is highly likely that we are witnessing the early stages of a wage-price spiral. This is especially relevant among the bottom 50% of households in developed economies.
Moreover, the availability of cheap labor was largely driven by globalization trends, which have decidedly shifted as geopolitical risks have increased worldwide. Since the souring of US-China relations in 2016, deglobalization trends have escalated in nearly all regions of the world. As a result, countries are prioritizing self-reliance at the expense of higher costs.
Tightening monetary conditions have made it more challenging for commodity businesses to access capital for new resource projects. Although the upward pressure on commodity prices has eased, the underlying issue of constrained resource availability has not been resolved. While policies like the selling of US strategic petroleum reserves may have a short-term downward impact on prices, it has an opposing and potentially more deleterious long-term effect. We believe it is only a matter of time before significant upward pressure on commodity prices resumes.
Furthermore, due to large social programs, investments in the green revolution, infrastructure construction, and defense spending, the US fiscal agenda has become highly extended. In fact, today’s government deficit is the largest in history relative to how low the unemployment rate is. The current situation can be viewed as one of the most conflicting policies in history, as the Federal Reserve is raising interest rates to address inflationary pressures while the government continues to engage in significant levels of expenditure. History has shown us repeatedly that excessive fiscal spending has inflationary consequences.
The recent technological advancements in artificial intelligence (AI) have the potential to be a countervailing and positive deflationary force in the long run, but AI is only in its early disruptive phases. It is an emotional factor driving the current speculation in popular tech stocks, but it not alleviating the structural inflationary pressures from more pressing issues like reckless deficit spending, the transition to a green economy, scarcity of natural resources, and trade deglobalization.
Additionally, the deceleration of inflation from peak levels has been rather slow when compared to other periods in history. To put it into perspective, we just had 10 consecutive monthly declines in CPI year-over-year and the index is still standing at 4.9%. Interestingly, the only other time this happened was during the aftermath of the 1919 Spanish Flu. Back then, CPI had a 12-month streak of declining year-over-year data, marking a bottom at the deeply deflationary rate of -15.8%. The current macro environment suggests that inflation is significantly ingrained in the economy.

The Long-term Demand Thesis for Commodities
In our opinion, this is one of the strongest macro setups for the long-term demand for commodities ever. For the past two decades, US industrial production has remained stagnant, despite experiencing exponential growth for the preceding 80 years. This stagnation is reflected in the fact that today’s level of production is equivalent to that of the early 2000s.
So, what changed since then?
China’s accession to the World Trading Organization in 2001 led to a substantial increase in its global export share from 2% to 15% today. As deglobalization continues to gather momentum, developed economies are likely to reinvigorate their manufacturing capabilities to mitigate geopolitical risks and lessen their reliance on authoritarian countries such as China.
As a result, major economies are expected to invest heavily in the reconstruction and modernization of their industrial infrastructure, creating a strong tailwind for the already undersupplied commodity market. Remember what China’s infrastructure spree meant to the natural resource industries in the 2000s? This time it should be larger because it will be driven by the G7 and its allies.
The current situation presents a unique opportunity for natural resource industries to perform exceptionally well, particularly at a time when these companies remain a fraction of the overall global equity market.
Gold Becomes Attractive When Financial Assets Are Expensive
The valuation cycle of the overall equity market often follows the gold cycle itself, and consequently, commodities are highly interconnected. Using one of the most traditional ways of assessing the state of the market, also Warren Buffet’s favorite indicator, the total market cap of the overall stock market as a percentage of GDP is currently slightly above where it was at the peak of the Technology Bubble in 2000. Historically, such excessive levels in this measurement would suggest that a gold cycle, and a secular bull market in commodities, are both underway.

The Most Relevant Macro Indicator
It is remarkable to observe how the gold-to-S&P 500 ratio is once again aligning with its historical performance, following significant distortions across the US Treasury curve. Our empirical analysis indicates that the current outperformance of precious metals compared to the overall equity market is still in its early stages. Specifically, looking back to 1970, this ratio has tended to appreciate by an average of 72% over the next two years after the US Treasury curve inverts by more than 70%. This indicator issued a warning signal in November 2022. As depicted by the yellow line, note the strong acceleration in return initiating at the 8th-month mark, which would imply the end of July in today’s scenario.
Considering the historically high valuations of financial assets, particularly when compared to commodities and gold, it is highly likely that both components of this trade could perform, meaning that precious metals could rise while equity markets decline. This scenario resembles previous instances such as the stagflationary crisis of 1973-1974 and the tech bust in the early 2000s during which the gold-to-S&P 500 ratio performed nearly twice as strongly as during other periods as illustrated by the blue line in the graph.
Overall, these historical trends suggest the potential for a significant opportunity in precious metals relative to equities given the current market environment.

A 2000-Like Meltup
The resemblance between the chart below, depicting the Nasdaq 100 during the year 2000, and the current meltup in US equities is indeed striking. However, what if we were to tell you that for the next 2 years, the white line collapsed by 80%?
By no means we are suggesting that history will repeat itself exactly, but the behavior of today’s market appears remarkably similar to the still-early stages of the tech bust. It is difficult to recall a time when investors were more complacent, especially considering that we are already one year into one of the steepest rate hikes in history. This is compounded by the fact that a multitude of significant issues is currently unfolding, presenting a long list of concerns that warrant attention:
- Corporate fundamentals deteriorating;
- More than 90% of the entire Treasury curve already inverted;
- Soft data is mostly at recessionary levels;
- Macro data starting to contract;
- Banks severely tightening their lending standards; and
- M2 money supply now falling the most in 60 years.
Never mind that as soon as these debt ceiling discussions are over, the government will be dumping at least another $1T worth of Treasuries into the market. This comes after a banking crisis triggered by a major decline in the value of these debt instruments. Now, ask yourself:
Are we appropriately pricing risk in this environment?
The Volatility Index (VIX) is at a mere 16, credit spreads are sub 200bps, and stocks have one of their most extreme valuations in history. To be clear, the recent market rally has been almost entirely driven by megacap tech stocks.
A wise market timer once said, “Beware when the generals lead and the soldiers are not following”.
Tech Stocks Are Way Over Extended
The notion that a potential reversal in the Fed policy back to easing mode would help to fuel the technology sector again appears to be broadly misguided. If interest rates were to be significantly lowered again, it would likely occur in a difficult macroeconomic environment where the fundamentals of tech companies would also be under severe pressure. It is worth mentioning that their overall earnings have already started to contract.
From our perspective, the cost of capital for corporations is in the midst of a structural increase that is not transitory. It should result in continued margin pressure making it increasingly challenging to justify today’s highly inflated valuations across the broad market, outside of undervalued resource industries.
Valuations matter, and this idea that tech companies will continue to exponentially improve their fundamentals is a likely false extrapolation of a past trend that is unsustainable, especially considering the remarkable earnings growth witnessed during the 2010s. Investors seem to be valuing businesses as if we are on the cusp of another decade of robust growth and a low-cost capital. We vehemently disagree with this perspective. Furthermore, the conventional thought that the market has already factored in the potential risks of a significant economic downturn is entirely counter to the balance of evidence across our arsenal of macro and fundamental indicators.
What transpired in 2022 in equity markets was merely the initial duration shock caused by a sharp increase in long-term Treasury yields. We have yet to experience the further decline in prices to reflect worsening corporate fundamentals and significantly rising credit spreads.
The chart below should be on everyone’s mind. The tech sector’s outperformance compared to the broader market has never been more extreme. As shown in the chart below, the ratio between tech stocks and the S&P 500 is now over two standard deviations above the historical mean. During other times when this indicator also reached such high levels, the tech sector significantly underperformed in the following decade. It’s unlikely that this time will be any different. When discount rates are structurally rising, the significance of valuations becomes more pronounced, especially when the growth rates in these businesses are substantially deteriorating.
A Critical Juncture in Corporate Fundamentals
There has been a significant contraction in diluted earnings, despite basic EPS being near all-time highs. Like the economy, corporate fundamentals undergo short and long-term cycles, and we are likely at the peak of another prolonged earnings growth period, which appears to be unsustainable.
The complacency of market participants during times of sustained expansion leads them to assume that the same level of exceptional growth will continue, but historical evidence suggests otherwise. It is important to highlight that the previous decade, the 2010s, witnessed an unprecedented surge in earnings. A similar development occurred during the 1920s and 1990s. Both decades experienced exceptional economic growth that was followed by significant contractions during the Great Depression and the Tech Bust.
Today, the risk of major deterioration in corporate fundamentals will likely be attributed to the mounting pressure from escalating labor and material costs, deglobalization problems, as well as the substantially higher cost of capital. Note that on the chart below, the aggregate earnings per share for the S&P 500 index has been confined within a rising 70-year channel. The upper part of this range historically marks critical turning points. At peak levels today, we believe we are at another key moment.
When Earnings Turn, Revenues Are Next
Thus far, one of the key takeaways from this earnings season is that profits have begun to disappoint while revenues have remained resilient. This is a common trend during a business cycle downturn. According to historical data, changes in EPS tend to precede changes in top-line growth by approximately one quarter. Recent reports indicate that corporate profits have fallen by 13%. By comparing this trend to previous hard-landing scenarios, such as the Tech Bust and the Global Financial Crisis, earnings contracted by 71% and 54%, respectively.
There is a reasonably high chance of a similar macroeconomic event unfolding this time, and it is evident that today’s valuation of the overall equity market still does not factor in this significant risk. It is important to keep in mind that the current market and fundamental downturn started from one of the most expensive stock markets in history and therefore has substantial further downside in the stagflationary hard landing scenario that we envision.
A Bear Market Rally Fueled by Looser Financial Conditions
Interest rates and financial conditions have been one of the primary factors affecting the recent moves in US equities, particularly during inflection points. Given these macro correlations, the potential for an increase in 10-year yields from current levels raises fundamental questions about the stability of financial markets.
To be more specific, the debt ceiling issue is setting the stage for one of the largest Treasury issuances in history. As the interest from significant buyers of US debt continues to decline and secular inflationary pressures persist, it is natural to wonder how the market will receive this flood of Treasuries.
Although investors have attributed the rise in 10-year yields in the last 2 years to inflationary factors, the surge in supply was arguably even more impactful. Keep in mind that every financial asset is intricately connected to US Treasuries.
For instance, the substantial decline in 10-year yields year-to-date has provided enormous support to long-duration assets, especially megacap stocks, which have accounted for nearly the entire gains in the S&P 500 so far this year. Our view is that long-term yields will experience upward pressure in the upcoming summer months, which could potentially result in significant implications for financial markets, with a particular impact on corporate bonds, megacap stocks, and private equity funds.
Megacap Techs At Risk
Valuation imbalances take time to deflate. After the initial phase of the bear market, complacency among investors has resumed at full steam while fundamentals continue to weaken. Megacap technology stocks are perceived long-term future growth stocks today so they are priced like ultra-long-duration assets. The assumed future high long-term growth is also another important factor contributing to the overvaluation. Neither the likely crimped future growth of these mature businesses nor the higher cost of capital is being discounted. Hence, there is still extraordinary downside risk for these overly popular and over-owned investments collectively in the unfolding macro environment.

Nvidia: The Clear AI Winner to Everyone Now
It is very clear to us that Artificial Intelligence is in the speculative froth stage. Just like the Internet bubble in 2000, from an investment standpoint, we the think biggest threat from AI is to investors in the abundance of hyped-up overvalued technology businesses that are all perceived to be big future winners, even perhaps among the biggest past AI market share winners and perceived juggernauts. At current valuations, the tech stock leaders of the unprecedented prior 14-year cycle, who all claim AI as a key driver of their future business model, collectively have much more to lose than to gain in the ultimate reordering. Too many of these past tech winners are perceived to be big future winners once again in the emerging AI battle, which is simply not how it works. The really big future winners in AI are likely to be the much earlier-stage businesses that are highly successful in applying AI technology in totally new and disruptive ways. The truth is that the investing world at large has absolutely no clue who these companies are going to be yet. As historical evidence to support this thesis, two of the biggest disrupters from the Internet era were Google and Facebook. Both these companies did not even emerge until AFTER the tech bust.
We would like to point out that Crescat featured Nvidia in its July 2014 investor letter and recommended it at a value investing conference to a group of money managers in June 2014 at a price of $4.73/share. That was the time to buy NVDA based on our model score and deep-dive fundamental analysis to get ahead of the AI craze, and we did it across our client portfolios. It led to an entire Rise of the Machines macro theme at Crescat. Nvidia went on to be the number one performing stock in the S&P 500 for each of the next three years straight. We sold it after a 5-bagger based on a deteriorating model score. In hindsight, we sold too soon. If we had held it until now, it could have been an 80-bagger. Such is the curse of the too-extreme value investor, which rest assured, we are still trying to learn from and improve on. For now, with just under a $1 trillion market cap and a P/E of 184, we believe the stock has overshot. Nvidia scores only in the 44th percentile in our overall fundamental model rank today and a low 11th percentile in our more-narrow value-rank component. We would caution strongly against buying it here.
FAANG Stocks Facing Secular Decline in Revenue Growth
All FAANG stocks have reported earnings now, and median revenue growth confirms a gradual long-term declining trend, which is now approaching negative levels. To be clear, this data is calculated in nominal terms. In other words, the recent upsurge in consumer prices due to inflation has significantly contributed to their top line. Real revenue growth is already substantially negative.
Investors continue to praise these companies for their defensive growth stock properties given the supposed stability and predictable nature of their businesses. The reality, however, is that FAANG still averages high double-digit P/E multiples and offers little to no growth in revenue and declining profits, which look even worse after inflation. In our view, what is transpiring is that these stocks, which indeed had been great growth stocks in the prior economic cycle, are now revealing their cyclical nature in their current much larger state. In other words, their businesses are vulnerable to stagflationary economic pressures today which is counter to the defensive thesis. The bigger point is that the popular large and mega-cap tech growth stocks of the last economic cycle look much more like cyclical stocks today and pose a much greater risk to overall markets than is currently acknowledged.
From Cash Cow to a Cash Bleeding Business
There’s been a clear fundamental shift in Amazon in the last couple of years. Their business has severely changed from being highly profitable to now experiencing major free-cash-flow losses to a degree that we have never seen before. Even though their top-line growth has been stalling, the stock still trades at an incredibly high multiple of earnings (110x), which seems completely unreasonable. It is noteworthy that other megacap companies are also struggling with the same issue of hitting a ceiling in terms of their revenue growth potential, while still trading at historically expensive multiples. Discount rates better not stay at their current elevated levels, otherwise, megacaps will likely be under severe pressure to be drastically re-priced.
Top Line Also Under Pressure
To note, Amazon’s earnings just collapsed by ~50% YoY and the stock still trades at 115x earnings with virtually no revenue growth in real terms.
Why Bother Buying Corporate Bonds Yielding Less Than Risk-Free Rate?
Corporate bonds yield less than the Fed Funds rate today. Such a depressed spread wasn’t even the case during the peak of the tech or housing bubble. This begs the question, why would anyone take significant extra risk to invest in these instruments?
During the Global Financial Crisis, credit spreads surged from almost 0% to 8.10% at the worst of times. Wait until these companies go back to the market and start refinancing their debt at significantly higher interest rates. Hard landings occur alongside large credit events, and we have yet to experience a blowout in corporate spreads as the economic downturn develops.
The Cost of Debt Is Structurally Rising While Equity Volatility Remains Suppressed
Junk bond yields are materially diverging from overall equity volatility, which appears to be unreasonably suppressed. To put this into perspective, the last time junk bonds yielded near the current levels, the VIX was hovering around 50. Today, equity volatility is at the same level as it was at the height of the S&P 500 in December 2021.
High-yield bonds are not the only instruments presenting this issue. Investment-grade bond yields are also elevated and completely disconnected from VIX levels, which are now at 2-year lows. Assessing the relevance of historical events, the current high multiples in US equity markets have not yet factored in the potential impact of a contracting economy and a cost of capital that exceeds the historical average. Hence, the existing low volatility among overall stocks is unwarranted and poised to rise significantly.
Options Craze
Call option volumes surged again to all-time highs this last quarter. This level of interest in derivatives is highly associated with the current retail trading frenzy. To be clear, this is not representative of a market bottom. Yes, the explosive growth in very short-term contracts also played a role, but broadly speaking, this is one of the most speculative environments in history.
Soft Data at Recessionary Levels
This business outlook index by the Philadelphia Fed clearly deserves more attention. The survey shows another sharp drop-in economic activity, approaching historical lows. This indicator has consistently foreshadowed economic downturns when reaching similarly depressing levels in the past 50 years.
To add, the current tightening of lending conditions among banking institutions is likely to exacerbate the risk of a recession in corporate earnings. Despite this, credit spreads at 2% and VIX below 20% do not accurately reflect the severity of the situation, and both are poised to rise significantly from today’s levels.
Business Loans Contracting
Commercial and industrial loans just had one of their worst 2-month contractions in history. The only other times we have experienced a similar problem was during the three last economic recessions. While the annual growth of business loans remains positive, it’s crucial to emphasize the short-term changes given the developments of the recent banking crisis. At a time when corporate fundamentals are weakening and the risk of a recession is looming, financial institutions are being compelled to tighten their lending conditions.
Let us not forget that the yield curve has been warning us all along. In November, more than 70% of the entire Treasury curve inverted, which is a signal that has never failed in forecasting severe economic downturns.
QT Picking Up Steam
The Fed’s holdings of US Treasuries had its largest weekly decline in history. While the credit support for the banks remains in place, the Fed is letting its security holdings mature at the fastest pace ever. This is not positive for the overall Treasury market, which is likely to be under severe pressure again given the massive amount of government debt issuances underway. We are likely experiencing a tectonic shift away from crowded 60/40 portfolios. US Treasuries, corporate bonds, technology stocks, and historically overvalued long-duration assets are at the heart of this transition and may suffer as a result.
Strong Jobs Market?
While the unemployment rate remains sub 4%, the number of permanent job losses has begun to rise significantly. The latest 2-month increase was as steep as in every recession that has transpired over the last 30 years. The prevalence of layoffs in higher-paying jobs has been increasing, causing a rise in the loss of permanent jobs. It is important to point out that the current strength of the labor market has been disguised by the ongoing demand for workers to perform jobs that are of a relatively lower skill level. The overall labor market is not as healthy as it seems.
Unskilled Jobs in High Demand
Low unemployment rates are obfuscating a larger issue in the labor market today. The recent strength in employment data has almost entirely been driven by unskilled jobs. In fact, the employment-population ratio among people with less than high school diplomas have recently surged to all-time highs. That is completely diverging from the same metric for workers with bachelor’s degrees and higher. Even though we have nearly 2 job openings for each unemployed person, most of those jobs available are not high-paying jobs.

Bank Failures
A reminder that back in the Global Financial Crisis over 150 banks went out of business. Today, 4 failures already equate to nearly the entire amount of assets financial institutions held during the banking crisis issue of 2008 and 2009.
If you are asking yourself whether the Fed will allow the same systemic problem to unfold today, look no further than gold prices starting to sniff out future liquidity injections to sustain financial stability.

The Case to Own Commodities and Sell Overall Stocks
While an economic crisis is looming, there is a significant long-term opportunity for investors to capitalize on the major valuation mismatch between tangible and financial assets. In simpler terms, commodities and businesses related to natural resources are currently undervalued, especially when compared to overall equity and bond markets as a whole. The chart below, provided by Incrementum AG, effectively illustrates this macroeconomic perspective and is arguably the most significant chart of the decade.
This represents the phenomenon known as the Great Rotation, wherein historically overvalued long-duration assets are being shifted towards a less populated and more undervalued segment of the market that is focused on the tangible assets at the core of the global economy. In our portfolio’s long positions, we have identified five important macro themes to capitalize on:
- Global Fiat Debasement: Gold is expected to regain its status as a central bank asset and serve as a hedge against inflation.
- Electrification Metals: There is a growing demand for resources that will power the ongoing transition towards a greener economy, while supply remains historically constrained.
- Energy Shortage: Investing in financially robust oil and gas businesses with high-quality assets that generate strong cash flow.
- Resource Underinvestment: This encompasses various natural resource industries that could benefit from a commodities cycle, including companies involved in uranium, agricultural commodities, fertilizers, and others.
- Brazil Liftoff: Geopolitically neutral economies driven by commodities are likely to be significant beneficiaries of the current macro environment.
These macro themes form the basis for our investment strategy, as we aim to seize the opportunities presented by the current macro landscape.
Commodities Are Interconnected
Commodity rallies are almost never isolated developments. Natural resource assets are highly interconnected and once one starts moving, the others follow accordingly. The relationship between gold and agricultural commodities is a good example.
Although we may assume these commodity assets have entirely unique price dynamics, the historical correlation between them is remarkably strong. As shown in the chart below, that was particularly the case during the precious metals bull market of the 2000s. We are likely experiencing the initial phase of another long-term gold cycle, and soft commodities shouldn’t be too far behind.
The same logic applies to base metals. Investors often contrast the cyclical nature of these metals, but their price behavior is notably analogous. The bottom line is, the current macro imbalances are setting the stage for tangible assets to perform exceptionally well over this decade, especially relative to historically overvalued stocks and fixed-income markets. While analysts love to argue about which inflationary period today’s environment resembles the most, it is important to emphasize that commodities outperformed financial assets during all three decades of the 1910s, 1940s, and 1970s.

Falling Copper Production
Chile’s overall copper production is currently as low as it was 18 years ago, nearly down 10% from its recent peak. It is important to note that Chile holds a dominant position in the supply of this metal, accounting for nearly 30% of the total global production, akin to the OPEC of the copper market. The potential transition to a green economy relies on an ample and accessible supply of metals, which is unattainable today.
High-grade copper discoveries are becoming increasingly challenging as most deposits found in the last decade are characterized by having low-grade mineralization that would not be economically viable at the current metal prices. Additionally, the potential nationalization of Chile’s lithium industry raises critical questions about the stability of the country’s copper market, which could further complicate the global supply of this metal.
These factors are among the main reasons for such a compelling demand and supply case for copper in the long term. In our strong opinion, the metals and mining industry is well-positioned for the next likely run-up of this commodity cycle.

Agricultural Commodities Lead Food Prices
Agricultural commodities are starting to appreciate again, indicating that food prices are poised to rise considerably from their current levels. Inflation continues to embed itself into the economy through various channels. To highlight some pivotal ones:
The lack of adequate investment in natural resources, combined with increasing living costs and consequent upward pressure on labor costs, as well as irresponsible fiscal spending and a trend towards deglobalization, have all contributed to the current economic landscape.
In contrast to the inflationary pressures experienced in the preceding three decades, the recent upsurge in consumer prices appears to be largely driven by persistent structural factors.
Energy Supply
US oil and gas companies have officially begun to reduce their number of operating rigs. This was the first 5-month contraction since 2020. These businesses are in no hurry to increase production in a market where supply remains incredibly limited. In fact, oil production is still 6% lower than pre-pandemic levels. If anything, the overall tightening of monetary conditions and the recent price volatility in energy commodities are severely affecting the capability of these companies to expand their resources.
Commodity Super Cycle
To address the recent comparisons with 2008, today’s macro setup could not be more different than the Global Financial Crisis. Back then, capital spending for oil producers was at record levels after a decade-long bull market in natural resource businesses. Today, aggregate capex is historically depressed while the commodities-to-equities ratio is near 50-year lows.
It’s important to consider the cross-asset correlations during the stagflationary crisis of 1973-4. Back then, tangible assets and resource businesses rallied drastically despite the collapse in stocks and bonds. Yes, one could claim that the oil embargo event was quite unique for this comparison. However, investors should not ignore other key tailwinds driving the energy market today:
ESG mandates and ongoing political efforts against commodity businesses;
- Historically tight supply;
- Rising geopolitical tensions.
Gold Majors Lack Vision
Newmont reported earnings recently, and despite gold prices approaching new highs their revenues continue to diverge materially. In fact, sales per share are at the same levels they were almost a decade ago. This phenomenon contributes significantly to the persistent underperformance of major gold companies relative to metal prices. The lack of vision among industry leaders is apparent and it’s imperative that investors start demanding these companies to re-direct their focus toward production growth and resource expansion.
This is laying the groundwork for early-stage mining businesses that are well positioned to benefit from the inevitable need from major companies to replenish their aging assets.
Brazil has arguably the cheapest commodity-led market/economy in the world today. Local banks are currently trading at one of the lowest price-to-book levels in history. Prior times when this industry was trading at such undervalued multiples also marked great buying opportunities.
While the political environment may portend some level of risk, today’s setup reminds me of the early 2000s. At that time, the rise in commodity prices created major capital interest from investors seeking further exposure to natural resources, completely disregarding the party in power. We would also argue that the degree of political polarization makes today’s leadership significantly more fragmented.
Overall Brazilian equities are now at their most undervalued levels since the impeachment of the president in 2016. Additionally, these stocks are being traded at similarly low multiples as they were during the global financial crisis. Unlike US markets that remain historically expensive, Brazil is one part of the world that offers a compelling macro and value opportunity.

Crescat’s Activist Metals’ Strategy and Performance Update
What an incredible time for shrewd investors to be putting money to work in early-stage, high-growth opportunities in the precious and base metals mining industries. For us, it is with great anticipation and excitement that we see gold prices leading the charge in the macro landscape today. We believe that gold is poised for a significant breakout.
We see the really big appreciation potential opportunity not in gold, however, but in the fragmented metals’ exploration segment of the mining industry that has been under continued pressure thanks to the Fed’s interest rate hikes which we think are soon to be over. We own many of these stocks as part of our Global Fiat Debasement and Electrification Metals themes. Unfortunately, they have been the largest contributor to the pullback year-to-date across Crescat’s three hedge funds and they have been under pressure during the Fed’s interest rate hiking campaign of the last 14 months which is about to end.
At Crescat, our value investment principles and models are what gives us the confidence to hang tough during pullbacks with the strong faith that the intrinsic value of our portfolios is substantially greater than the current market price at any given time. As such, we believe pullbacks in Crescat’s strategies offer great opportunities for both new and existing investors to deploy capital.
While nobody likes to see the market value of their investment portfolio go down, we are very comfortable accepting a moderate amount of risk in this regard, in the short run, in order to realize the strong returns that are possible from our macro themes and valuation models both in the short run and over complete business cycles. Given our strong value-investor orientation that drives our high-appreciation-seeking strategy, it is important to understand that significant upside volatility is the goal. But in achieving that goal, downside volatility is also a necessary and integral part of the path. In our experience, this is the only way that we know how to achieve returns that outperform the broad stock market and inflation over time. However, clients that desire less overall volatility can also just make a lesser relative allocation to Crescat’s strategies and/or can combine Crescat’s strategies with cash and short-term fixed income investments to reduce their risk.
Most importantly, we ask our clients to embrace a mindset that inevitable pullbacks in Crescat’s strategies are not a permanent loss of capital and to be able to hang in there with us through them for their ultimate good. Otherwise, our strategies will not be suitable for them.
For us, the personal confidence for such a mindset comes from our overriding long-running experience and investment process which is grounded in a future-looking value-oriented strategy with a macro thematic overlay. Our process has been supported by extensive and evolving proprietary models throughout. Our models include:
- A systematic AI-primed fundamental equity model for large and mid-cap stocks that we have continuously been running, evolving, and applying to managing client portfolios for 26 years;
- A suite of totally unique, independent, and organically developed macro models
- An emerging suite of deep-dive industry-specific models, developed in coordination with leading industry experts in hard rock mining, energy (Oil and Gas), and biotechnology
For us right now, in going through the recent pullback, our spirits are not down at all. On the contrary, we get very excited when assets with extraordinary intrinsic value and critical economic purpose get simply too cheap for unsustainable reasons because it is an opportunity to put money to work. For all the investors who have ever followed Crescat, and believe in what we are doing here, if you have been waiting for a decent-sized pullback as an opportunistic time to get in, we believe now is the time.
The Fed’s debt accommodation policies and interest rate suppression have served to create extreme overvaluation and speculation in financial assets that has built up over the last 14 years. The Fed is now being forced to burst that bubble. Our activist mining stocks are not the bubble. They have been battered enough already since the peak of the last mining cycle in 2011. Resource companies can absolutely be a productive part of the solution to containing inflation in the long run, but not if they are starved of capital which only makes the inflation problem and the world’s likely coming economic suffering worse. It takes years, often a whole decade or more to make major metal discovery and then ultimately get it into production. The mining industry has been starved of capital for at least a decade already. The world has a huge supply gap.
This is entirely what Crescat’s value proposition as an activist investor in the industry is all about, bringing significant capital to the highly fragmented exploration segment and creating substantial value through expert-deployed activist capital to make substantial new metal discoveries. We have created a truly one-of-a-kind conduit for sophisticated high-net-worth and institutional investors to enter the space in a significant way. Our goal is to catalyze the entire industry by creating a diversified portfolio of new and incipient metals discoveries.
Traditionally, most large pools or capital have stayed away from this space. They view most of these companies as speculative small and microcap stocks with too little liquidity for them to play in any size. That is where the big value creation opportunity lies and where Crescat has come in. Making a viable economic discovery is not easy, but it is well worth the reward. The exploration and discovery side is where billionaires in this industry have made their fortunes. The appreciation potential is extraordinary, but the risk is high too. This is all the more reason why a diversified activist portfolio approach that Crescat is focused on can triumph.
The majors have abdicated Greenfield drilling and discovery to the smaller exploration companies, but there are limited capital markets to serve them. Crescat has been bridging the gap. Serious high-net-worth and institutional investors interested in gold, electrification metals, and commodities, that would otherwise view this segment as being too risky and illiquid now have a means to invest with us to create extraordinary value. There is no shortage of opportunities for substantial capital deployment in this industry.
The world needs metals to make the green energy transition, but it does not have the future supply of them to meet this demand. The demand is happening whether we like it or not. The course has been set. At Crescat, we are not just looking for big new gold deposits to deliver wealth creation and inflation protection against reckless fiscal and monetary policies. We are also dedicated to finding the supply of silver, copper, nickel, and other critical metals that we need for the electrification wave, electric grid, Evs, batteries, wind, and solar.
Fortunately, Crescat has already had a three-year head start in this effort. We have directly funded and built an incredible portfolio of companies with 286 million target gold equivalent ounces of probability-adjusted bona fide and incipient discoveries. These include major new discoveries in viable mining jurisdictions around the world of gold, silver, copper, nickel, and other metals. Our portfolio is tremendously undervalued and underappreciated. In our model, Crescat’s activist metals portfolio is worth many multiples of where the market is pricing it today, with the highest appreciation potential since we developed the model two years ago. This is how we go to sleep at night when our head hits the pillow.
The Fed’s recent tightening has already been more than sufficient to burst the bubble in financial assets with its traditional lag effect, the year-to-date tech stock counter rally notwithstanding. We have significant short positions in our Global Macro and Long/Short funds to hedge to capitalize on this opportunity which has much more to play out in our view. When we use the term “financial assets”, it is meant to include mostly stocks and bonds at large. We say it this way, however, it is to distinguish financial assets from commodity assets and natural resource business. While the latter are also stocks and assets, of course, they can perform extremely well and in the opposite direction of financial assets during rising inflationary environments. We are confident that the Fed can do little to stop inflation over the next decade. Today’s inflation is broad and structural and occurs with a substantial lag. Reliance on deficit spending is at the core of future long-term embedded inflation, along with persistent wage-price spiral pressures, trade deglobalization, and critical natural resource underinvestment.
Because of these factors, it is the metals resource area that we have chosen to focus a substantial portion of our long exposure today for what we believe are extremely sound value and macro reasons. We believe an entirely new economic cycle is starting to unfold that will prove quite different from the one that began with the Global Financial Crisis in 2008-2009. We would like to accomplish something big and bold that we view as highly constructive and positive for the world and our investors in both the near and long term over the full course of this new cycle.
While most of the rest of the world is still busy chasing the bubble stocks of the last cycle, we have instead been busy working to find and fund the early-stage companies that have the highest-probability shot at being the -multi-bagger winners of the new one.
Recently, the market price of our portfolio has been overly impacted by selling pressure and limited liquidity in the exploration segment of the mining industry today. However, we believe the intrinsic value of these businesses are substantially greater than where the market is currently valuing them. Our holdings include bona fide and incipient major discoveries, and as we enter a gold cycle, we expect very strong demand for these high-quality assets, and we are determined to raise substantial new high-net-worth and institutional capital to be a leading conduit in providing new liquidity to the space. We believe our investors will be highly rewarded.
Over the past three years, we have accumulated activist investments in what we consider to be the most exciting companies in the precious and base metals sectors worldwide. Our portfolio companies control large new target metal deposits that offer multi-fold upside appreciation potential based on the unsustainably wide gap between current low market prices and the target size of our deposits based on estimates of those by our geologic expert Quinton Hennigh, PhD.
Together with Quinton, the Crescat investment team has built an extensive valuation model that we use to score and value our companies based on the stage of discovery, expected future profitability, style of deposit, grade, jurisdiction, level of engagement, quality of management and technical team, analysis of ongoing drill results and other geologic data, probability of M&A, and target valuation/appreciation potential. We use current commodity prices in our model. If our macro view for higher metals prices unfolds, our appreciation potential targets will increase. Having both the macro and micro value creation drivers is what gets us truly excited about our odds of delivering.
When the market significantly deviates from our intrinsic value calculations, as it has this year, we are confident that it presents an excellent opportunity for both new and existing clients to deploy capital into Crescat’s strategies.
Additionally, the short side of our Global Macro and Long Short portfolio has also contributed to our recent underperformance. We believe that the current macro environment offers an incredible opportunity to short historically overpriced financial assets. The recent market strength outside of the scarce resource space and especially for megacap tech stocks reminds us of previous bear market rallies that eventually resumed their major downward trends. This time is unlikely to be different, and we strongly believe the next leg lower is imminent.
We sincerely hope this letter has presented a comprehensive and well-researched macro case for investing in tangible assets and commodity businesses as well as shorting financially overvalued assets. The pullback in our strategies from their high-water marks is not unlike the worst of it for us and our investors in 2008. We rebounded strongly in 2009 and 2010 to new high-water marks. We believe we are poised to rebound strongly again and have never been more excited about the combined long and short opportunities in the market. Please remember that our precious metals fund delivered 252% after fees in just its first 10 months. These are the type of upside returns that we are striving for and more within our activist metals themes and believe we can deliver to more than justify the risk. We certainly did not expect to be down as much as we are year to date, but we are confident this is an incredible opportunity for investors to add here, and our goal is to get performance turned around immediately and push to new high-water marks post haste. We strongly believe that we can and will.

Sincerely,
Kevin C. Smith, CFA
Member & Chief Investment Officer
Tavi Costa
Member & Portfolio Manager
Important Disclosures
Performance data represents past performance, and past performance does not guarantee future results. An individual investor’s results may vary due to the timing of capital transactions. Performance for all strategies is expressed in U.S. dollars. Cash returns are included in the total account and are not detailed separately. Investment results shown are for taxable and tax-exempt clients and include the reinvestment of dividends, interest, capital gains, and other earnings. Any possible tax liabilities incurred by the taxable accounts have not been reflected in the net performance. Performance is compared to an index, however, the volatility of an index varies greatly and investments cannot be made directly in an index. Market conditions vary from year to year and can result in a decline in market value due to material market or economic conditions. There should be no expectation that any strategy will be profitable or provide a specified return. Case studies are included for informational purposes only and are provided as a general overview of our general investment process, and not as indicative of any investment experience. There is no guarantee that the case studies discussed here are completely representative of our strategies or of the entirety of our investments, and we reserve the right to use or modify some or all of the methodologies mentioned herein.
This presentation is not an offer to sell securities of any investment fund or a solicitation of offers to buy any such securities. Securities of a fund managed by Crescat may be offered to selected qualified investors only by means of a complete offering memorandum and related subscription materials which contain significant additional information about the terms of an investment in the Fund and which supersedes information herein in its entirety. Any decision to invest must be based solely upon the information set forth in the Offering Documents, regardless of any information investors may have been otherwise furnished, and should be made after reviewing such Offering Documents, conducting such investigations as the investor deems necessary and consulting the investor’s own investment, legal, accounting and tax advisors in order to make an independent determination of the suitability and consequences of an investment in the Fund.
Risks of Investment Securities: Diversity in holdings is an important aspect of risk management, and CPM works to maintain a variety of themes and equity types to capitalize on trends and abate risk. CPM invests in a wide range of securities depending on its strategies, as described above, including but not limited to long equities, short equities, mutual funds, ETFs, commodities, commodity futures contracts, currency futures contracts, fixed income futures contracts, private placements, precious metals, and options on equities, bonds and futures contracts. The investment portfolios advised or sub-advised by CPM are not guaranteed by any agency or program of the U.S. or any foreign government or by any other person or entity. The types of securities CPM buys and sells for clients could lose money over any timeframe. CPM’s investment strategies are intended primarily for long-term investors who hold their investments for substantial periods of time. Prospective clients and investors should consider their investment goals, time horizon, and risk tolerance before investing in CPM’s strategies and should not rely on CPM’s strategies as a complete investment program for all of their investable assets. Of note, in cases where CPM pursues an activist investment strategy by way of control or ownership, there may be additional restrictions on resale including, for example, volume limitations on shares sold. When CPM’s private investment funds or SMA strategies invest in the precious metals mining industry, there are particular risks related to changes in the price of gold, silver and platinum group metals. In addition, changing inflation expectations, currency fluctuations, speculation, and industrial, government and global consumer demand; disruptions in the supply chain; rising product and regulatory compliance costs; adverse effects from government and environmental regulation; world events and economic conditions; market, economic and political risks of the countries where precious metals companies are located or do business; thin capitalization and limited product lines, markets, financial resources or personnel; and the possible illiquidity of certain of the securities; each may adversely affect companies engaged in precious metals mining related businesses. Depending on market conditions, precious metals mining companies may dramatically outperform or underperform more traditional equity investments. In addition, as many of CPM’s positions in the precious metals mining industry are made through offshore private placements in reliance on exemption from SEC registration, there may be U.S. and foreign resale restrictions applicable to such securities, including but not limited to, minimum holding periods, which can result in discounts being applied to the valuation of such securities. In addition, the fair value of CPM’s positions in private placements cannot always be determined using readily observable inputs such as market prices, and therefore may require the use of unobservable inputs which can pose unique valuation risks. Furthermore, CPM’s private investment funds and SMA strategies may invest in stocks of companies with smaller market capitalizations. Small- and medium-capitalization companies may be of a less seasoned nature or have securities that may be traded in the over-the-counter market. These “secondary” securities 12 often involve significantly greater risks than the securities of larger, better-known companies. In addition to being subject to the general market risk that stock prices may decline over short or even extended periods, such companies may not be well-known to the investing public, may not have significant institutional ownership and may have cyclical, static or only moderate growth prospects. Additionally, stocks of such companies may be more volatile in price and have lower trading volumes than larger capitalized companies, which results in greater sensitivity of the market price to individual transactions. CPM has broad discretion to alter any of the SMA or private investment fund’s investment strategies without prior approval by, or notice to, CPM clients or fund investors, provided such changes are not material.
Benchmarks
HFRX GLOBAL HEDGE FUND INDEX. The HFRX Global Hedge Fund Index represents a broad universe of hedge funds with the capability to trade a range of asset classes and investment strategies across the global securities markets. The index is weighted based on the distribution of assets in the global hedge fund industry. It is a tradeable index of actual hedge funds. It is a suitable benchmark for the Crescat Global Macro private fund which has also traded in multiple asset classes and applied a multi-disciplinary investment process since inception.
HFRX EQUITY HEDGE INDEX. The HFRX Equity Hedge Index represents an investable index of hedge funds that trade both long and short in global equity securities. Managers of funds in the index employ a wide variety of investment processes. They may be broadly diversified or narrowly focused on specific sectors and can range broadly in terms of levels of net exposure, leverage employed, holding periods, concentrations of market capitalizations and valuation ranges of typical portfolios. It is a suitable benchmark for the Crescat Long/Short private fund, which has also been predominantly composed of long and short global equities since inception.
PHILADELPHIA STOCK EXCHANGE GOLD AND SILVER INDEX. The Philadelphia Stock Exchange Gold and Silver Index is the longest running index of global precious metals mining stocks. It is a diversified, capitalization-weighted index of the leading companies involved in gold and silver mining. It is a suitable benchmark for the Crescat Precious Metals private fund and the Crescat Precious Metals SMA strategy, which have also been predominately composed of precious metals mining companies involved in gold and silver mining since inception.
RUSSELL 1000 INDEX. The Russell 1000 Index is a market-cap weighted index of the 1,000 largest companies in US equity markets. It represents a broad scope of companies across all sectors of the economy. It is a commonly followed index among institutions. This index contains many of the same securities as the S&P 500 but is broader and includes some mid-cap companies. It is a suitable benchmark for the Crescat Large Cap SMA strategy, which has predominantly held and traded similar securities since inception.
S&P 500 INDEX. The S&P 500 Index is perhaps the most followed stock market index. It is considered representative of the U.S. stock market at large. It is a market cap-weighted index of the 500 largest and most liquid companies listed on the NYSE and NASDAQ exchanges. While the companies are U.S. based, most of them have broad global operations. Therefore, the index is representative of the broad global economy. It is a suitable benchmark for the Crescat Global Macro and Crescat Long/Short private funds, and the Large Cap and Precious Metals SMA strategies, which have also traded extensively in large, highly liquid global equities through U.S.-listed securities, and in companies Crescat believes are on track to achieve that status. The S&P 500 Index is also used as a supplemental benchmark for the Crescat Precious Metals private fund and Precious Metals SMA strategy because one of the long-term goals of the precious metals strategy is low correlation to the S&P 500.
References to indices, benchmarks or other measures of relative market performance over a specified period of time are provided for your information only. Reference to an index does not imply that the fund or separately managed account will achieve returns, volatility or other results similar to that index. The composition of an index may not reflect the manner in which a portfolio is constructed in relation to expected or achieved returns, portfolio guidelines, restrictions, sectors, correlations, concentrations, volatility or tracking.
Separately Managed Account (SMA) disclosures: The Crescat Large Cap Composite and Crescat Precious Metals Composite include all accounts that are managed according to those respective strategies over which the manager has full discretion. SMA composite performance results are time-weighted net of all investment management fees and trading costs including commissions and non-recoverable withholding taxes. Investment management fees are described in Crescat’s Form ADV 2A. The manager for the Crescat Large Cap strategy invests predominantly in equities of the top 1,000 U.S. listed stocks weighted by market capitalization. The manager for the Crescat Precious Metals strategy invests predominantly in a global all-cap universe of precious metals mining stocks.
Hedge Fund disclosures: Only accredited investors and qualified clients will be admitted as limited partners to a Crescat hedge fund. For natural persons, investors must meet SEC requirements including minimum annual income or net worth thresholds. Crescat’s hedge funds are being offered in reliance on an exemption from the registration requirements of the Securities Act of 1933 and are not required to comply with specific disclosure requirements that apply to registration under the Securities Act. The SEC has not passed upon the merits of or given its approval to Crescat’s hedge funds, the terms of the offering, or the accuracy or completeness of any offering materials. A registration statement has not been filed for any Crescat hedge fund with the SEC. Limited partner interests in the Crescat hedge funds are subject to legal restrictions on transfer and resale. Investors should not assume they will be able to resell their securities. Investing in securities involves risk. Investors should be able to bear the loss of their investment. Investments in Crescat’s hedge funds are not subject to the protections of the Investment Company Act of 1940. Performance data is subject to revision following each monthly reconciliation and annual audit. Current performance may be lower or higher than the performance data presented. The performance of Crescat’s hedge funds may not be directly comparable to the performance of other private or registered funds. Hedge funds may involve complex tax strategies and there may be delays in distribution tax information to investors.
Investors may obtain the most current performance data, private offering memoranda for Crescat’s hedge funds, and information on Crescat’s SMA strategies, including Form ADV Part II, by contacting Linda Smith at (303) 271-9997 or by sending a request via email to lsmith@crescat.net. See the private offering memorandum for each Crescat hedge fund for complete information and risk factors.
