


Precious metals reached a peak on August 7th and the sector proceeded to enter a correction that has seen gold and silver gyrate in a volatile and frustrating range for the last ten weeks. Gold has reached a peak decline of ~11.5% from its $2089 high on August 7th, and silver has fallen as low as $21.81 (-27% from its $29.91 high on August 7th).
Mining shares have also experienced a stiff correction since early August, with many producers declining 20% or more from peak to trough. Meanwhile, many junior miners have suffered share price declines of 40% or more since their early August heydays. It was clear then, just as it is clear now, that the precious metals sector was overheated in early August and a corrective process was overdue.
The good news is that from everything I see out there today, I think the correction in the precious metals and mining sector is coming to a close. The correction is now at the ten week mark and it has served to shake loose a large number of bandwagon bulls while creating a healthy wall of worry for bulls to climb. Sentiment has also spent some time in bearish territory and investor expectations have moderated.
Perhaps most notably, we have seen mining shares begun to outperform the metals in recent weeks:
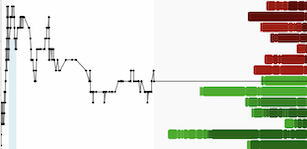
Gold vs. Gold Bugs Index (HUI) vs. GDXJ since August 12th, 2020 (Initial spike low in gold/silver)

Gold is actually lower than it was at the close on August 12th, whereas, gold mining shares are higher by roughly 5%.
This is the sort of gradual outperformance that we tend to see from the miners as the corrective process reaches its final chapters; at this point, the correction has been largely through time while prices have oscillated within a narrowing range.
Turning to the daily chart of the GDXJ we can see that an important moment is at hand as price bumps up against the top rail of a bullish flag pattern that has formed since August:
GDXJ (Daily)

Relative Strength (Daily 14-period RSI) has already broken its downtrend and moved back above the median line, this is a healthy technical condition which often precedes a breakout in price.
Turning to the weekly chart of GDXJ we can more clearly see the bull flag that has formed since the summer:
GDXJ (Weekly)

A weekly close above the $60.00 level in GDXJ would confirm an upside breakout from the flag pattern, targeting fresh 52-week highs over the next couple months.
Everything that I see and understand from a fundamental and technical perspective indicates that the precious metals correction is drawing to a close and mining shares could be well on their way to fresh highs before year end. I have followed my own advice and used the correction since August to add to my favorite junior miner positions.
In November, we will discuss tax loss selling opportunities in my annual post on tax loss silly season. Until then, I hope you enjoy the transition from a corrective phase to the next leg higher in precious metals and mining shares.
DISCLAIMER: The work included in this article is based on current events, technical charts, company news releases, and the author’s opinions. It may contain errors, and you shouldn’t make any investment decision based solely on what you read here. This publication contains forward-looking statements, including but not limited to comments regarding predictions and projections. Forward-looking statements address future events and conditions and therefore involve inherent risks and uncertainties. Actual results may differ materially from those currently anticipated in such statements. This publication is provided for informational and entertainment purposes only and is not a recommendation to buy or sell any security. Always thoroughly do your own due diligence and talk to a licensed investment adviser prior to making any investment decisions. Junior resource companies can easily lose 100% of their value so read company profiles on www.SEDAR.com for important risk disclosures. It’s your money and your responsibility.
